

Our Risk and Reward Model (RRM) for smarter land-based investment decisions
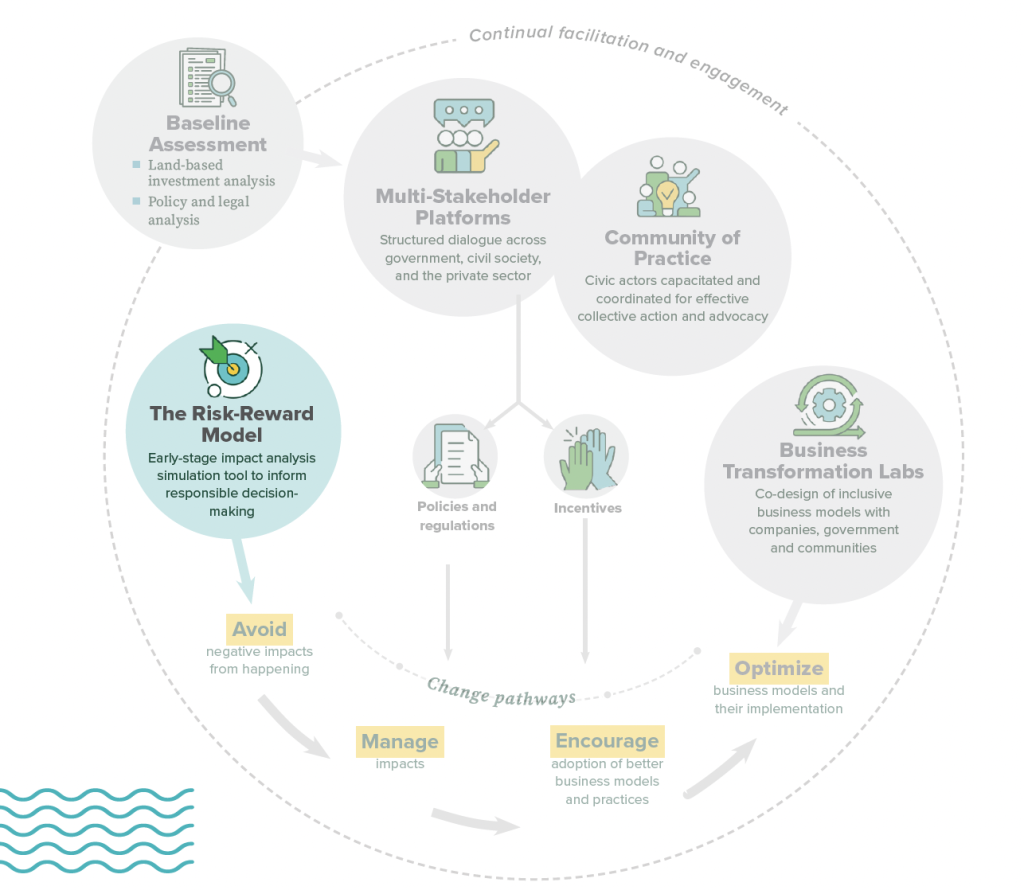
The TLI approach uses integrated change pathways to guide country engagement through evidence, collaboration, and co-creation. This is delivered through four core tools: Multi-Stakeholder Platforms, Communities of Practice, Business Transformation Labs, and the RRM.
What is the RRM?
The RRM is a decision-support tool, developed by CIFOR-ICRAF and partners, that helps governments, investors, and communities understand how the benefits and risks of land-based investments are distributed and where they can be better balanced. It brings evidence and transparency to investment targeting, allowing stakeholders to identify where rewards can be maximized and risks reduced before projects are approved or scaled.
Why does it matter?
Land-based investments in agriculture and forestry are expanding rapidly, yet decision-makers often lack consistent information about their social, economic, and environmental implications. The RRM addresses this by providing a balanced picture of each investment’s performance, showing trade-offs between profit, people, and the planet.
CIFOR-ICRAF DEVELOPMENT TEAM
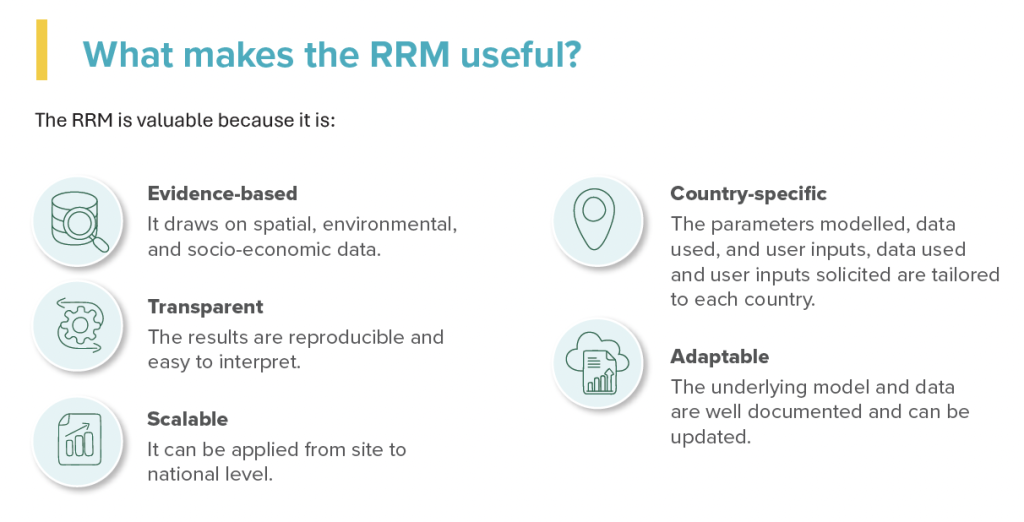
The RRM helps visualize how investments perform not just financially, but in terms of social inclusion and environmental responsibility – helping stakeholders make more balanced decisions.
How does it work?
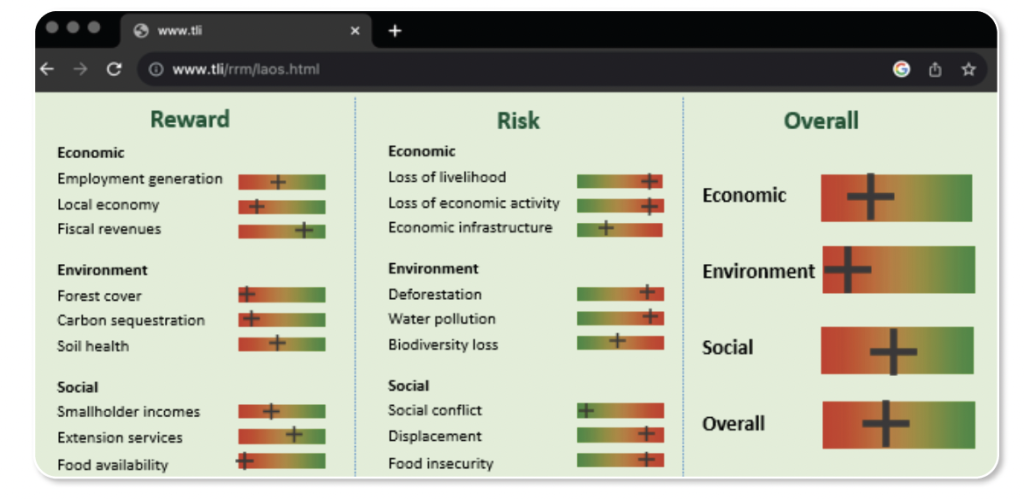
The RRM comprises a web-based platform that allows users to upload or select investment sites, define business model parameters, and generate colour-coded maps and summary scores that show areas of high, medium or low risk and reward. This helps governments and investors anticipate where risks are concentrated, what kinds of rewards can be enhanced, and how interventions can reduce negative impacts.
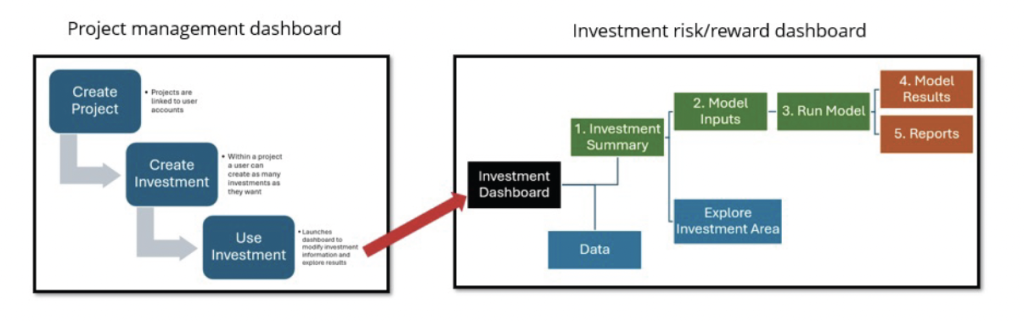
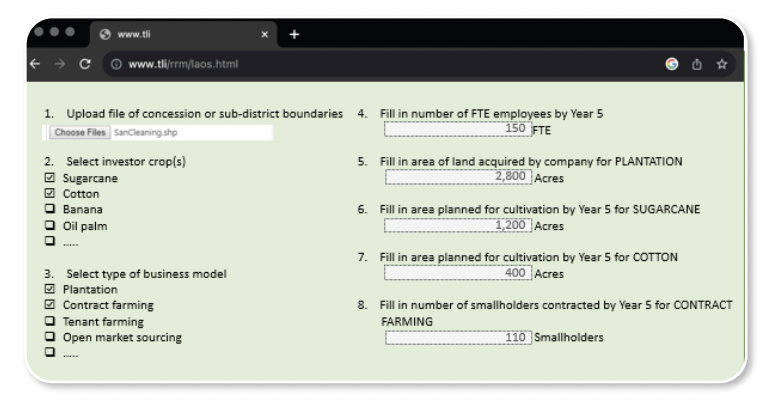
The RRM goal is to identify and avoid investment practices with high risks and encourage those with high rewards. To do so, it integrates two types of data:
- User input on the estimated location of the investment, and the characteristics of the investment.
- Baseline statistical data to assess the potential risks and rewards of the hypothetical investment relative to the best available data.
The RRM produces a comparable risk and reward profile across three dimensions:
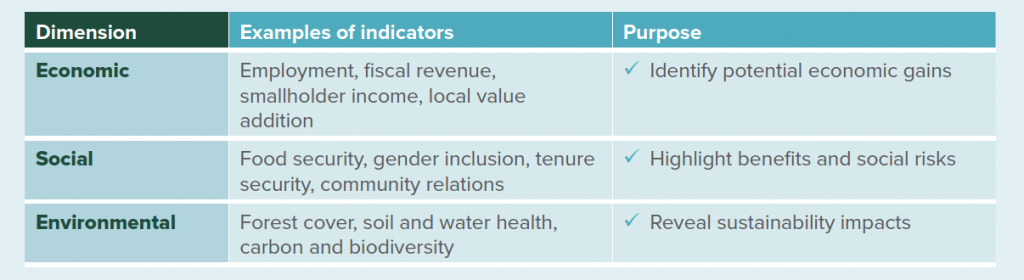
Each indicator is weighted and normalized to generate composite scores that can be mapped visually. Colour-coded outputs show areas or investment types with high reward and low risk, as well as those needing closer scrutiny or policy intervention.